History
Since most of my video game and book library has shifted from analog to digital, it's become increasingly difficult to complete something once started. This feeling has a few names:
Backlog paralysis / backlog guilt: having so many options that starting (or sticking) to one feels weirdly stressful.
Analysis paralysis: overthinking what to play next, which can lead to constant switching.
Binge-sampling / “Netflix effect” (informal): starting a ton of things because they’re instantly available, then dropping fast since there’s no friction.
In an attempt to curb this behavior, I started tracking what games and books I’m interesting in consuming. I first started with a simple view in my Notes app in late 2024 but it quickly got out of hand (and it was too easy to ‘fudge’ an entry).
I ended up switching to an app called Sofa which seemed to fit the bill—losing all of my data during an app upgrade kept me from fulling adopting it.
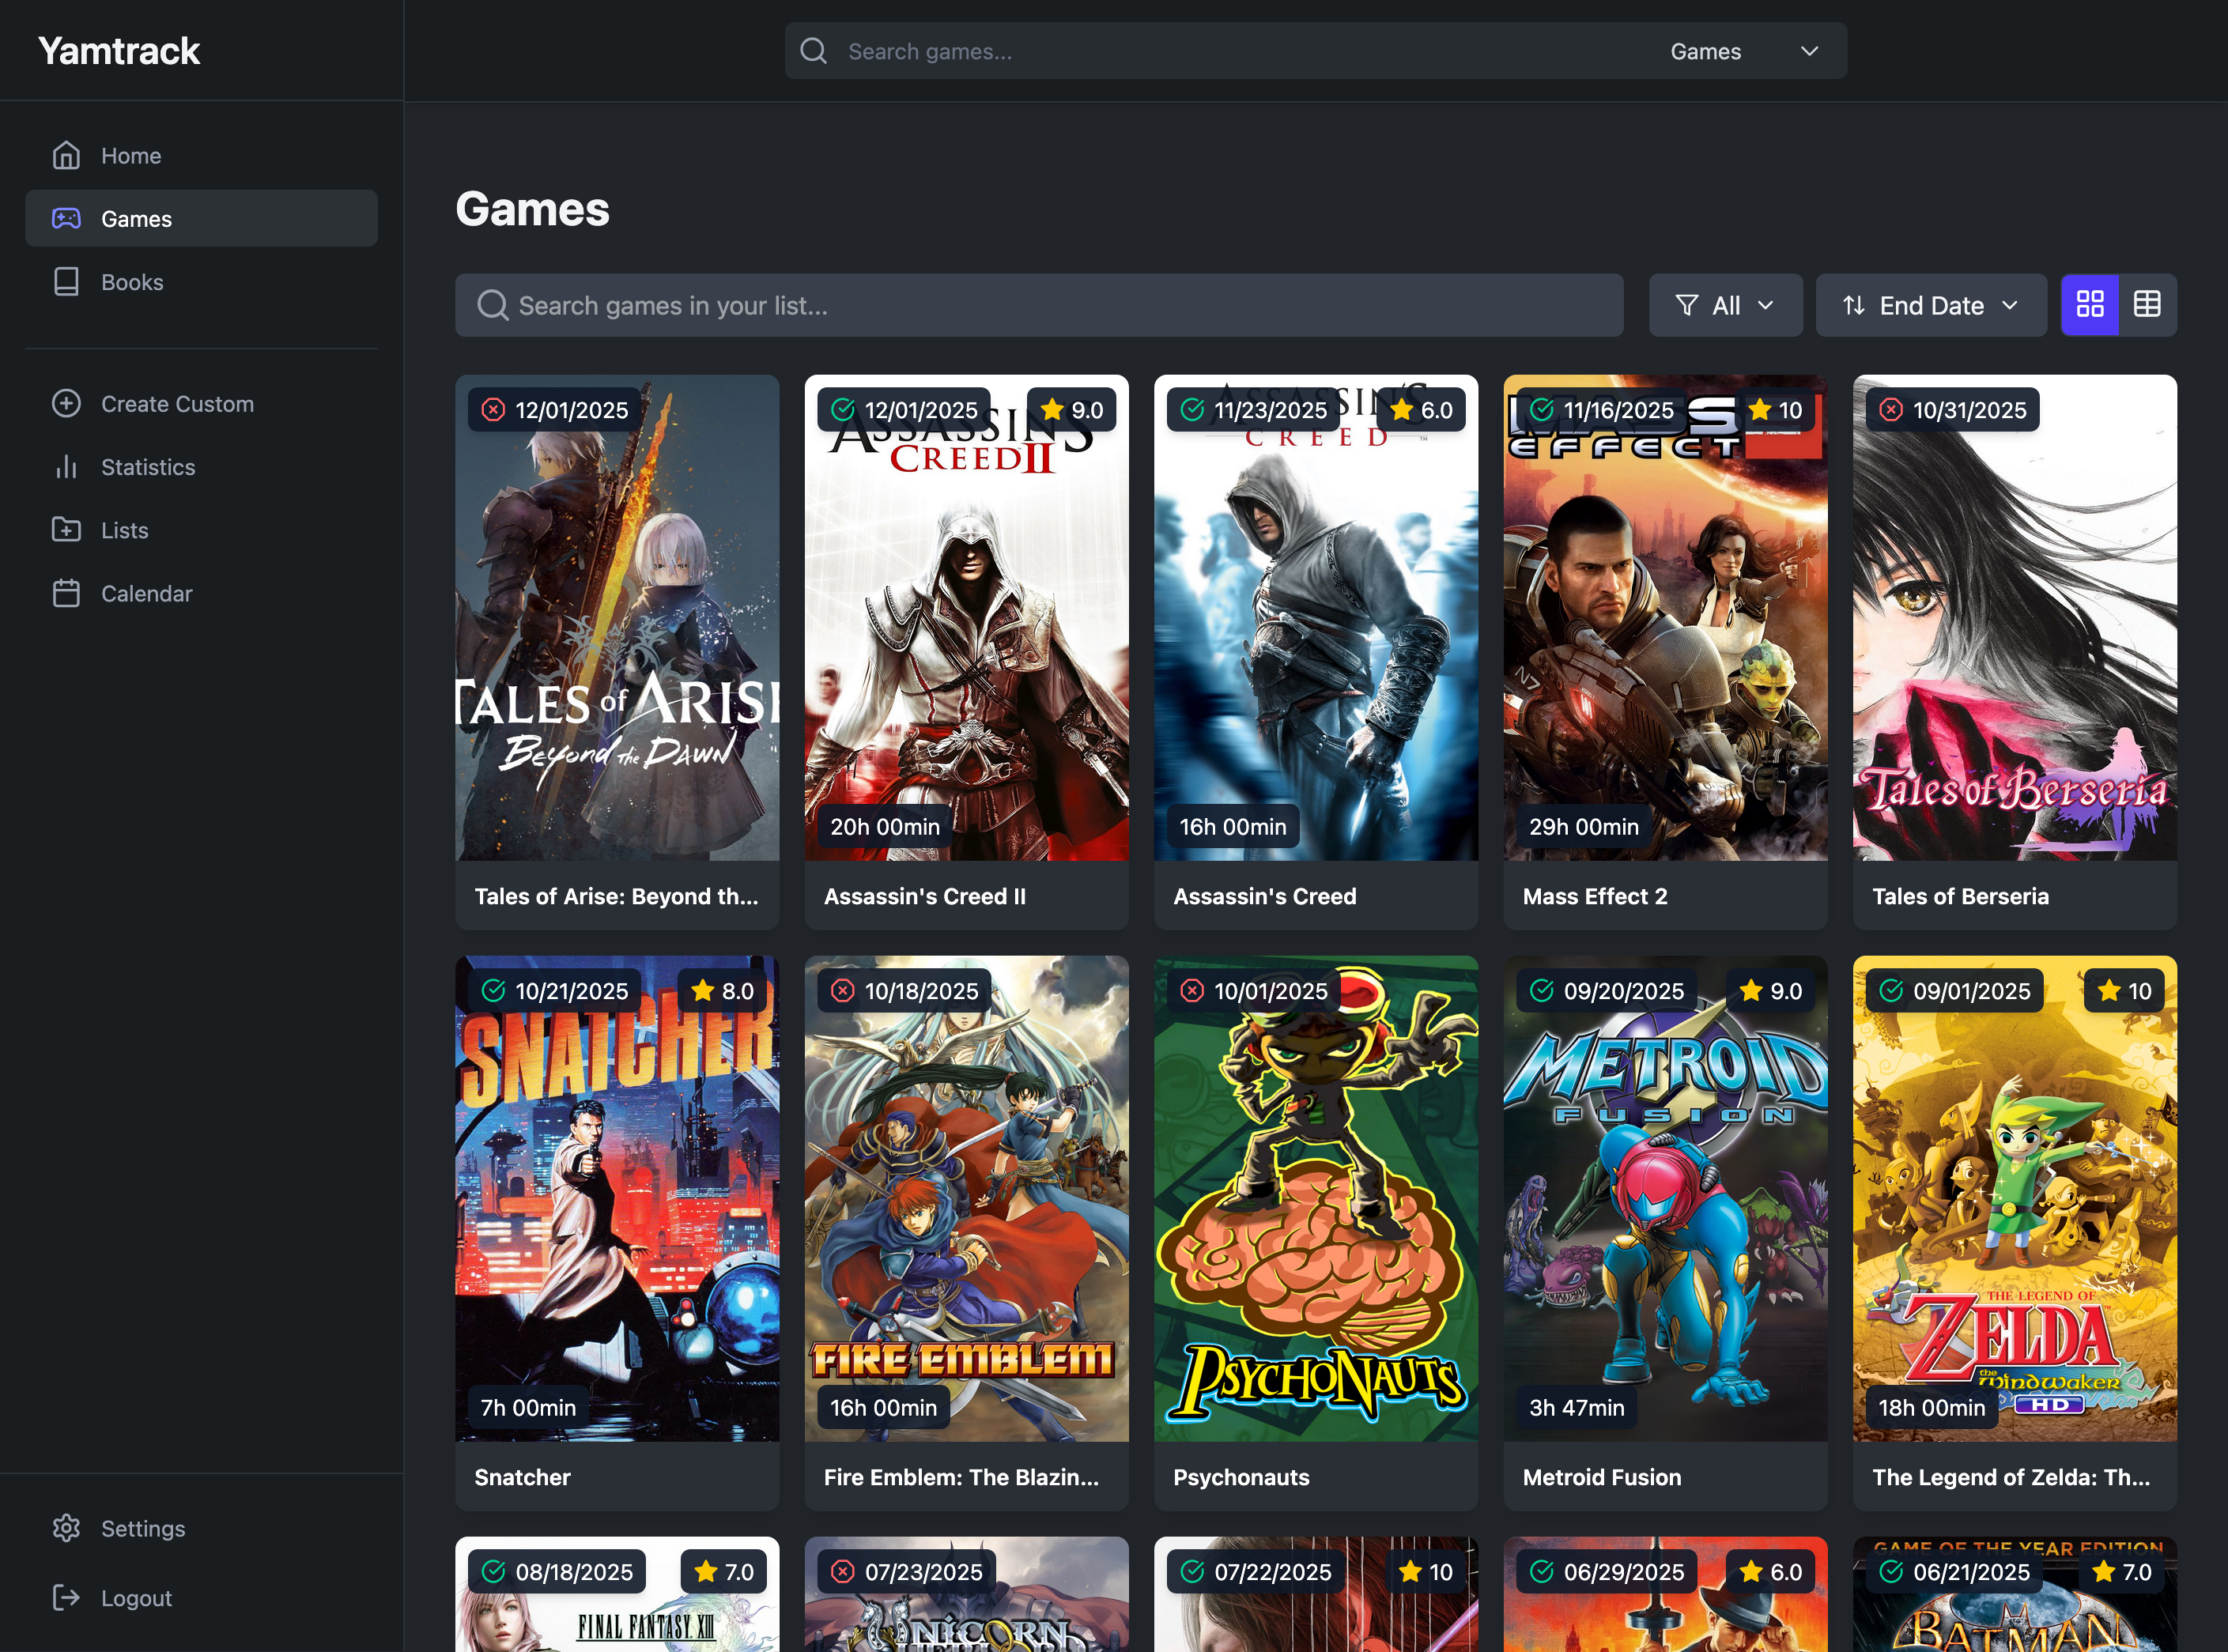
This sounded like another good excuse to self-host a solution. I tried out a few options (like Ryot and Obsidian). I needed something super simple, no frills and easy to maintain—enter Yamtrack https://github.com/FuzzyGrim/Yamtrack. One of the best features is their stats view—it’s a huge motivator to see not just how many books or games I’m interested, but just how many I’ve managed to complete!
Overview
A big part of staying on-top of stuff in progress is seeing the actual cover out of context. For example, when I'm reading a phyiscal book I'll keep it on a display stand so it's always visible (top of mind) and easy to grab. To do this digitally would be a worthwhile effort.

I built a custom dashboard system that transforms inexpensive Android tablets into dedicated digital photo frames that display my gaming and reading activity. The dashboard pulls data from Yamtrack, a self-hosted media tracking application, and presents it in a rotating slideshow optimized for portrait-mode displays.
The Hardware
Dragon Touch 10.1" WiFi Digital Picture Frame
- 1280×800 HD IPS touchscreen
- Android 6.0
- Perfect size for a desk or shelf display
These budget tablets (~$40) aren't designed to run custom software, but with some ADB (Android Debug Bridge) manipulation, they make excellent dedicated dashboard displays.
The Software Stack
Backend: Python HTTP Server
A lightweight Python server (backend.py) that:
- Connects directly to the Yamtrack SQLite database (read-only)
- Serves JSON API endpoints for different data views
- Hosts static HTML dashboard files
- Runs in a Docker container for easy deployment
Key API Endpoints:
/api/in-progress- Currently playing games and reading books/api/stats- Comprehensive statistics with charts and top-rated lists/api/monthly- Recent activity (last 16 items across all media)
Frontend: Rotating Slideshow Dashboard
Three distinct views cycle every 10 seconds in fullscreen:
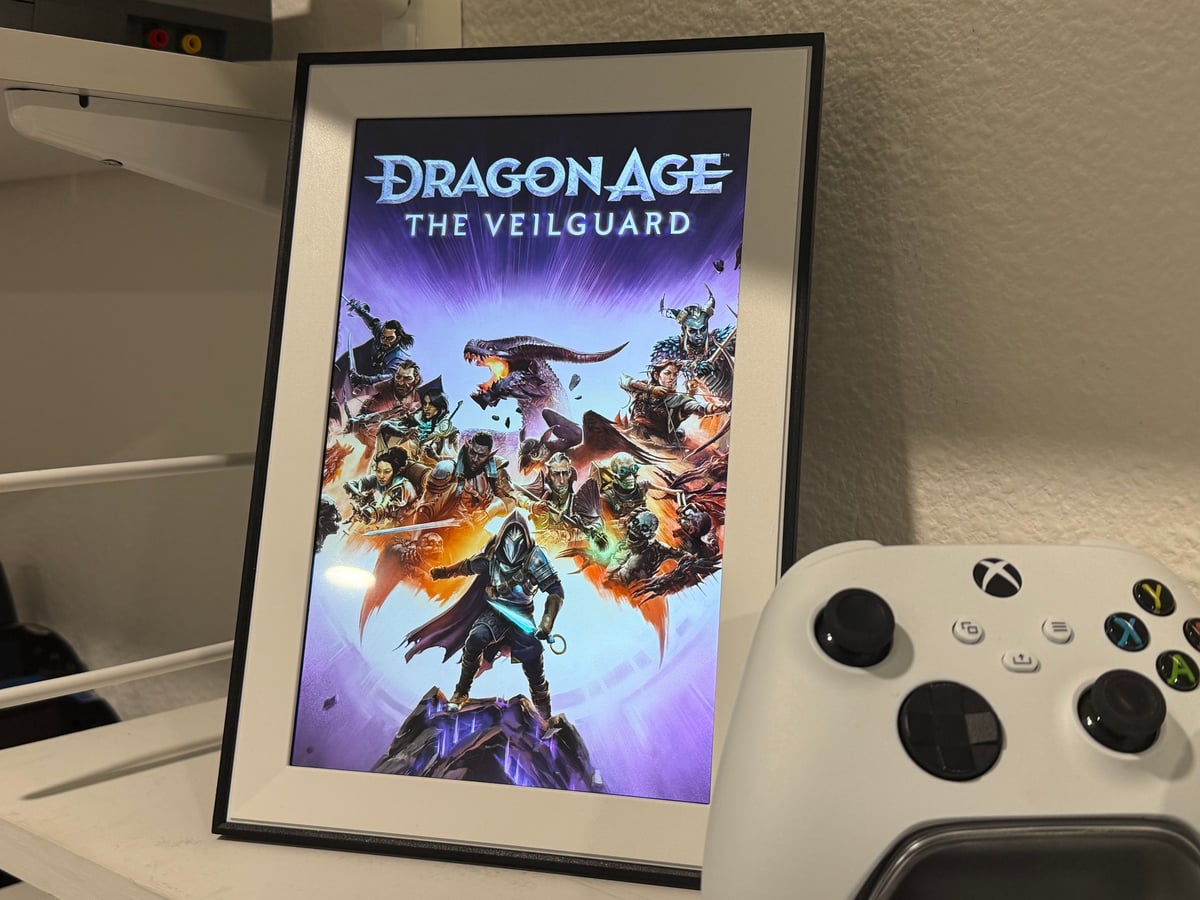
1. In Progress View Shows what I'm currently playing/reading with:
- Cover art thumbnails
- Progress tracking (hours played / pages read)
- Last activity dates
- Custom status icons (▶️ In Progress, ⏸️ Paused, ❌ Dropped)
2. Stats View Annual statistics visualization featuring:
- Total games/books and time invested
- Status breakdowns with doughnut charts (powered by Chart.js)
- Top 15 rated games and books with scores
- All-time totals and averages
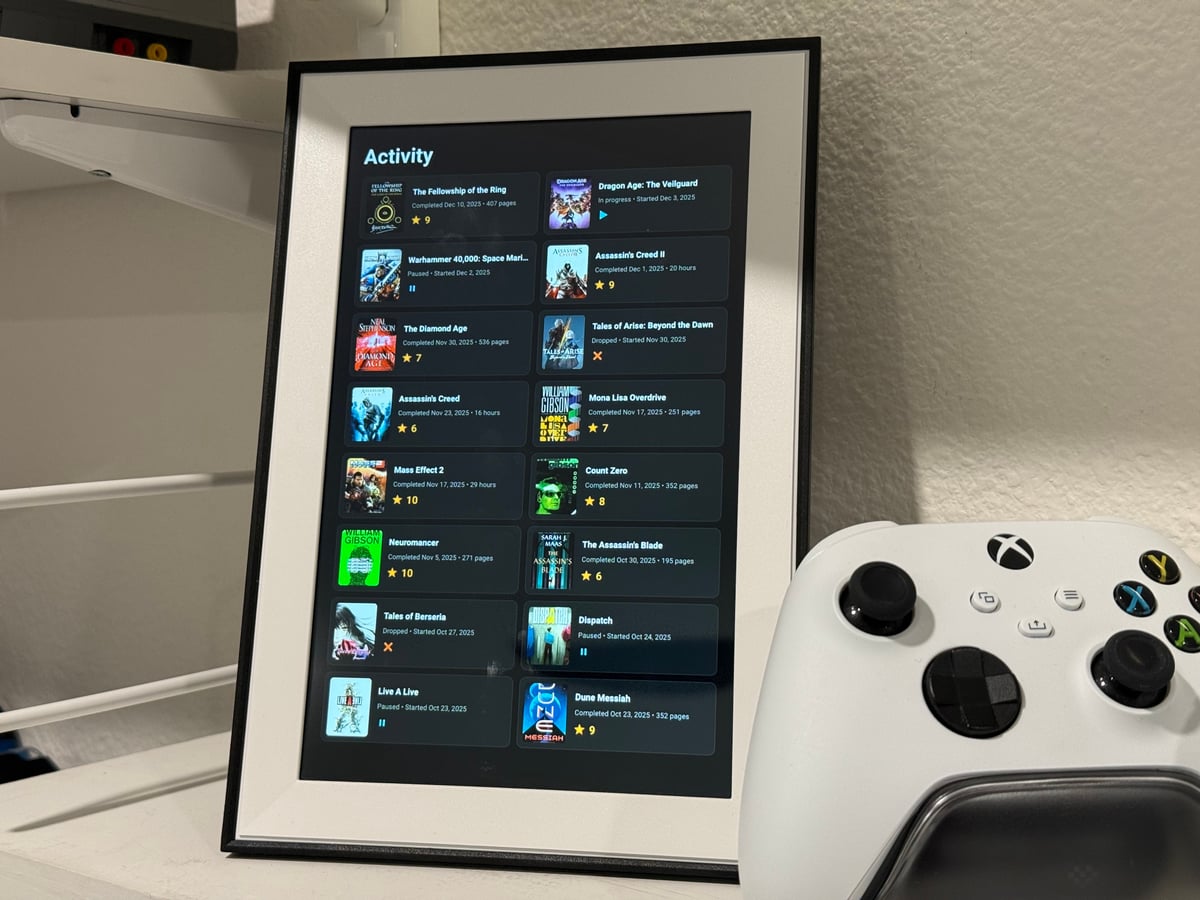
3. Activity View Recent completions and new starts:
- Last 16 items sorted by most recent activity
- Completion dates with time invested
- Star ratings for completed items
- Start dates for in-progress items
Design Philosophy
Fixed Grid Layout With the 800×1280 pixel constraint, I optimized for a fixed 16-item grid (8 rows × 2 columns) rather than time-based filtering. This ensures the display always looks full and balanced.
Dark Theme
- Deep blacks (#0a0a0a background)
- Subtle borders and cards (#1a1a1a, #2a2a2a)
- Gold accent color for ratings (#FFB300)
- Optimized for ambient lighting conditions
Date Handling Logic A critical feature was accurate completion tracking:
- Completed items show
end_date(when finished) - In-progress items show the most recent of
progressed_atorstart_date - This prevents showing misleading dates when metadata is updated
Automation & Control
ADB Launch Scripts
Automated tablet control via Android Debug Bridge:
launch-firefox.sh and launch-firefox-frame2.sh
# Target specific device by IP
adb -s [device ip] shell monkey -p org.mozilla.firefox -c android.intent.category.LAUNCHER 1
# Navigate to dashboard URL
adb -s [device ip] shell input text "[dashboard ip]"
These scripts:
- Launch Firefox
- Clear the URL bar
- Load the dashboard
- Enter fullscreen mode
Intelligent Brightness Control
Time-Based Brightness (set-brightness.sh)
- Morning (6-9 AM): 180/255 (70%)
- Daytime (9 AM-6 PM): 255/255 (100%)
- Evening (6-10 PM): 60/255 (23%)
- Night (10 PM-6 AM): 50/255 (20%)
Home Assistant Integration (set-brightness-ha.sh)
The more sophisticated approach queries Home Assistant entities:
# Example rules
"$CURTAIN_ENTITY|open|eq|220|Curtains are open"
"$SUN_ENTITY|below_horizon|eq|60|Sun is down"
"$LIGHT_SCENE_ENTITY|movie|eq|30|Movie scene active"
This allows brightness to respond to:
- Curtain position (automated with sunrise)
- Active lighting scenes
- Sun position
- Room occupancy
- Any other Home Assistant state
Deployment
Docker Compose Setup
yamtrack-dashboard:
  image: python:3.11-slim
  volumes:
    - /path/to/yamtrack/db.sqlite3:/db/db.sqlite3:ro
    - ./dashboard:/app
  environment:
    - YAMTRACK_DB_PATH=/db/db.sqlite3
    - YAMTRACK_USER_ID=1
    - PORT=8007
  ports:
    - "8007:8007"
The dashboard container:
- Mounts the Yamtrack database read-only
- Runs the Python backend
- Exposes port 8007 on the local network
- Accessible via Tailscale for remote monitoring
Network Architecture
- Yamtrack runs in its own Docker container
- Dashboard connects to the shared database volume
- Tablets access via local IP (192.168.4.2:8007)
- No external dependencies or cloud services
Technical Challenges & Solutions
Challenge: SQLite Database Locking
Problem: Docker volume mounts don't support SQLite's file locking on network filesystems.
Solution: Read-only database mount prevents write conflicts. For local testing, copy database to /tmp:
cp /Volumes/docker/yamtrack-dashboard/test-data/db.sqlite3 /tmp/test-db.sqlite3
Challenge: Accurate Completion Dates
Problem: The progressed_at field updates whenever metadata changes, not just when completing an item.
Solution: Discovered and utilized the end_date field for completed items:
if row['status'].lower() == 'completed':
    last_played = row['end_date']
else:
    last_played = max(filter(None, [row['progressed_at'], row['start_date']]))
Challenge: Consistent Display Grid
Problem: Date-range filtering (e.g., "last 30 days") produces variable item counts, leaving gaps in the layout.
Solution: Fixed-count approach (last 16 items) ensures the grid is always full:
allItems.slice(0, 16).forEach(item => {
    activityGrid.appendChild(createItem(item));
});
Challenge: Android 6 Limitations
Problem: Ancient Android version with no modern kiosk mode apps.
Solution: Firefox + fullscreen mode + ADB automation:
- Wake Lock API keeps screen on
- Fullscreen API maintains immersive mode
- Automatic re-entry when fullscreen exits
- 5-minute auto-refresh for live updates
Future Enhancements
Potential additions:
- Weather widget integration
- Calendar view of activity by month
- Genre/category breakdowns
- Reading/playing streaks and goals
- Multi-user support with user switching
- Voice control via Home Assistant
- Motion sensor activation (wake display when approaching)
Key Takeaways
- Repurpose cheap hardware - Budget tablets make excellent dedicated displays
- Direct database access - Simpler than building APIs when you control the data
- Fixed layouts for fixed screens - Don't fight responsive design constraints
- Home automation synergy - Brightness control tied to existing automations
- Read-only is safe - No risk of corrupting the source database
Code & Resources
All code for this project is available at: [Your repo URL]
Technologies used:
- Python 3.11 (HTTP server)
- SQLite (Yamtrack database)
- Vanilla JavaScript (no frameworks)
- Chart.js 4.4.0 (statistics visualization)
- Docker & Docker Compose
- Android Debug Bridge (ADB)
- Home Assistant (optional integration)
Conclusion
What started as a simple "show my currently playing games" project evolved into a comprehensive media tracking dashboard with smart home integration. The tablets now serve as ambient displays that provide at-a-glance insights into my media consumption habits while blending seamlessly into my home automation ecosystem.
- Total project time: ~8 hours over 2 days
- Total hardware cost: ~$80 (2 tablets)
- Total software cost: $0 (all open source)
The satisfaction of seeing your media library beautifully displayed on dedicated hardware? Priceless.